I recently read an article by Andrew Pavlo warning young developers against using mmap as a replacement for buffered IO (pread/pwrite) in their DBMS. His argument is essentially that it would be a mistake to use mmap to manage file I/O in DMBS. This immediately reminds me of Prometheus - an open source project that uses mmap to map its data blocks from disk to memory. Prometheus’ tsdb borrowed ideas from levelDB and rocksDB that use mmap. Our company’s DMP (an excellent universal database management platform) uses Prometheus to collect metrics; it’s integrated into one of the DMP components called “umon”. If there is a problem with Prometheus, we want to be the first to know. In this article, we will go on a tour to dive deeper into mmap and find out why database people hate and love mmap.
A brief of the pros and cons of using mmap
How mmap came into the picture
In the late 1980s, a typical computer had 128 KB of RAM, a typical computer memory was both scarce and expensive. Then with SunOS 4.0 came the clever idea of mapping files into memory. A summary of this idea is that the kernel loads library files into physical memory once and shares them between different processes, so that the kernel doesn’t have to load library objects into physical memory separately for each process and physical memory can be reused.
Advantages of using mmap
System calls are avoided
System calls were designed to bridge the gap between kernel and user memory. The gap was intentionally imposed to prevent the user program from jumping to an arbitrary location in memory and executing OS code, which of course is done for security reasons. Kernel related things like kernel data, kernel code, kernel stack and kernel heap segments live in the kernel memory area and are invisible to the user program, this is called memory segmentation. And this segmentation is the reason why system calls are needed: to safely hand over control to the kernel code with predefined and security-aware interfaces. When a user program invokes a system call, a “syscall switch” occurs. I prefer to call it “syscall switch” to ease the reader’s mind, since the term “context switch” has traditionally been used for “process context switch”. When we use mmap to map a file into virtual address space, only one system call is required: mmap(2). Instead, if we use pread/pwrite for file I/O, the program must make a syscall for each read/write operation. This is partly, as a common wisdom,why mmap is supposed to give better performance.
The reason why a context switch is slow, is primarily due to the TLB (translation-lookaside buffer) flushing. The TLB is the fastest cache within a CPU that exploits locality. It caches page table entries, which are stored in each process’s memory descriptor named mm_struct, which contains all memory areas of a process. Therefore, when a context switch occurs, PTEs of the TLB should be invalidated. This invalidation and the subsequent refilling of the cache make context switches slow. However, these are old facts, TLBs on modern computers are tagged, so a context switch does not necessarily flush a computer’s TLB. Like what is described in armV8 documentation:
For non-global entries, when the TLB is updated and the entry is marked as non-global, a value is stored in the TLB entry in addition to the normal translation information. This value is called the Address Space ID (ASID), which is a number assigned by the OS to each individual task. Subsequent TLB look-ups only match on that entry if the current ASID matches with the ASID that is stored in the entry. This permits multiple valid TLB entries to be present for a particular page marked as non-global, but with different ASID values. In other words, we do not necessarily need to flush the TLBs when we context switch. When a context switch takes place, the CPU may simply change the active ASID, it’s why TLBs are now called taged TLBs. The point here is that even a context switch is not that costly on modern computers.
Moreover, we need to understand that a “syscall switch” is not a real “context switch”, but is often perceived as a “mode switch”, which usually involves the following steps on a Intel processor:
- Switching the SP (stack pointer) to the kernel stack.
- Saves the user mode SP,PC(program counter),prviledge mode
- CPL (current privilege level) is changed from 3 to 0. This level is segmentation related.
- Sets the new PC to the system call handler (via code mapping)
These steps are not costly at all, and even a process-level context switch is not that costly on a modern computer. Below are two code snippets that you can run on your own machine.On an Intel(R) Xeon(R) Gold 6148 CPU @ 2.40GHz cloud machine (2 cores) from Alibaba Cloud, running the first code snippet shows that the process- context switch takes about 1800ns on average, while the second shows that it takes about 380ns on average to execute a lightweight getpid system call. These two numbers are not scary in any way.
#include <assert.h>
#include <stdio.h>
#include <stdlib.h>
#include <string.h>
#include <sys/time.h>
#include <sys/wait.h>
#include <unistd.h>
#include <fcntl.h>
#include <sched.h>
#include <iostream>

#define N_ITERATIONS 1000000

long nanosec(struct timeval t)
{
return ((t.tv_sec * 1000000 + t.tv_usec) * 1000);
}

int main()
{
cpu_set_t set;
CPU_ZERO(&set);
CPU_SET(0, &set);
long N_iterations = 1000000;
// creating two pipes
int p1[2]; // parent -> child
int p2[2]; // child -> parent
if (pipe(p1) == -1)
exit(1);
if (pipe(p2) == -1)
exit(2);

    switch (fork())
    {
    case -1: // probabaly due to resource limit
        exit(3);
    case 0:
        // in child process
        // see https://man7.org/linux/man-pages/man2/sched_setaffinity.2.html if you have any question
        if (sched_setaffinity(getpid(), sizeof(cpu_set_t), &set) == -1)
        {
            exit(4);
        }
        close(p1[1]);
        close(p2[0]);
        for (int i = 0; i < N_ITERATIONS; i++)
        {
            char buf[0];
            while (read(p1[0], &buf, sizeof(buf)) == -1)
            {
            }
            write(p2[1], &buf, sizeof(buf));
        }
        return 0;
    default:
        // in parent process
        if (sched_setaffinity(getpid(), sizeof(cpu_set_t), &set) == -1)
        {
            exit(5);
        }
        close(p1[0]);
        close(p2[1]);
        struct timeval start_time, end_time;
        int res;

        res = gettimeofday(&start_time, NULL);
        assert(res == 0);

        for (int i = 0; i < N_ITERATIONS; i++)
        {
            char buf[0];
            write(p1[1], &buf, sizeof(buf));
            while (read(p2[0], &buf, sizeof(buf)) == -1)
            {

            }
        }
        res = gettimeofday(&end_time, NULL);
        assert(res == 0);
        std::cout << "average nanoseconds to perform context switch is: " << (nanosec(end_time) - nanosec(start_time)) / N_iterations * 1.0 << std::endl;
        wait(NULL); // wait for child to exit
    }
    return 0;
}
#include <sys/time.h>
#include <unistd.h>
#include <assert.h>
#include <stdio.h>
#include <stdlib.h>
#include <time.h>

#define N_ITERATIONS 1000000

long nanosec(struct timeval t)
{
return ((t.tv_sec * 1000000 + t.tv_usec) * 1000);
}

int main()
{
int i, res;
unsigned long pid;
float avgTimeSysCall;
struct timeval t1, t2;

    res = gettimeofday(&t1, NULL);
    assert(res == 0);
    for (i = 0; i < N_ITERATIONS; i++)
    {
        unsigned long syscall_code = 39; //syscall_64.tbl#L69
        asm("movq %1, %%rax\n" // use inline assembly here
            "syscall\n"
            "movq %%rax, %0\n"
            : "=r"(pid)
            : "m"(syscall_code)
            : "rax", "rdi");
    }

    res = gettimeofday(&t2, NULL);
    assert(res == 0);
    printf("Average nanoseconds for System Call getpid(pid: %ld) is: %f\n", pid, (nanosec(t2) - nanosec(t1)) / (N_ITERATIONS * 1.0));
}
User Buffer Is Not Needed
When working with read/write operations, the kernel by default does not actually read from or write to a disk, but simply copies data between a buffer in user space and a page cache in kernel space. The reason for this is the same as why processors need an L1 and L2 cache: The kernel caches pages because reading from a file system, either over the network (e.g., NFS) or the local disk, is very slow compared to reading from memory. If a database does many I/O intensive operations, using mmap is considered faster since a user buffer is not involved, therefore, there is no need to copy the data from kernel buffer cache to the user buffer. This also helps saving computer memory.
The linux manual of read(2) shows that a userspace buffer named buf is needed, that’s the userspace buffer that the data is copied into.
#include <unistd.h>
ssize_t read(int fd, void *buf, size_t count);
In prometheus, a mmaped file is defined as:
type MmapFile struct {
f *os.File  // MmapFile is closable with os.File
b []byte
}

...

func (f *MmapFile) Bytes() []byte {
return f.b
}

// mmap is how Prometheus calls mmap system call
// it returns a pointer to the mmaped memory if there is no error
func mmap(f *os.File, length int) ([]byte, error) {
return unix.Mmap(int(f.Fd()), 0, length, unix.PROT_READ, unix.MAP_SHARED)
}
Don’t be misleaded by the b []byte, this b here is nothing but a pointer to our virtual memory, there is no data copied to userspace when Prometheus call unix.Map. Besides, from the above memory protection filed unix.PROT_READ you can see that Prometheus does not map writable memory, the memory mapping is read-only.
However, a DBMS that has a buffer pool typically uses O_DIRECT to read/write a file, as another solution to the “double caching” problem. It buffers data objects on its own behalf in userspace and bypass the page cache that is provided by the virtual memory system. For example, MySQL uses innodb_flush_method=O_DIRECT by default for reading/writing data files. Here I explicitly mentioned data files for the fact that the usage of O_DIRECT by pass the page cache, but it doesn’t gurantee the file to be flushed into disk, therefore MySQL still uses fsync for its log files like redolog.
Easy to use
Why mmap is easy to use? Let’s see how Prometheus is using it.
Here is some Prometheus code in prometheus/tsdb/index/index.go that shows how to use mmap:
// code that shows how Bytes() may be used
hash := crc32.Checksum(w.symbolFile.Bytes()[w.toc.Symbols+4:hashPos], castagnoliTable)
You can see from the code basically treats the mmaped file as a huge flat array of bytes. A simple mmap call gives you a flat array of bytes that can be accessed directly, this is how easy it is to use mmap.
Disadvantages of using mmap
As have aforementioned, mmap was brought into Unix by the SunOS people with an intention of sharing library object files among processes. When multiple processes share the underlying same library object, data consistency becomes a problem, which is solved by a notion called private sharing(copy-on-write and demand paging). But when it comes to a DBMS, can we still simply use copy-on-write mmap and pretend the OS has magically solved everything for us? The answer is no.
Operating systems provide three address space operations of particular interest: the mmap and munmap system calls (collectively referred to as “memory mapping operations”), and page faults.
- mmap creates memory mapping regions and adds them to the region tree.
- munmap removes regions from the tree and invalidates entries in the hardware page table structures.
- Page faults look up the faulting virtual address in the region tree and, if the virtual address is mapped, install an entry in the hardware page table and resume the application.
In Andy’s paper, he mentions three major problems:
- Transactional safety
- I/O stalls
- No interfaces for asynchronous IO.
- IO stalls are unpredictable since page eviction is at the mercy of the OS.
- Error handling
- Performance issues
- Page table contention
- Single-threaded page eviction
- TLB shootsdown
The first two problems can be summaried as the DBMS loses control over page faulting and eviction, we focus on the Performance issuessince it’s not well explained.
page table contention
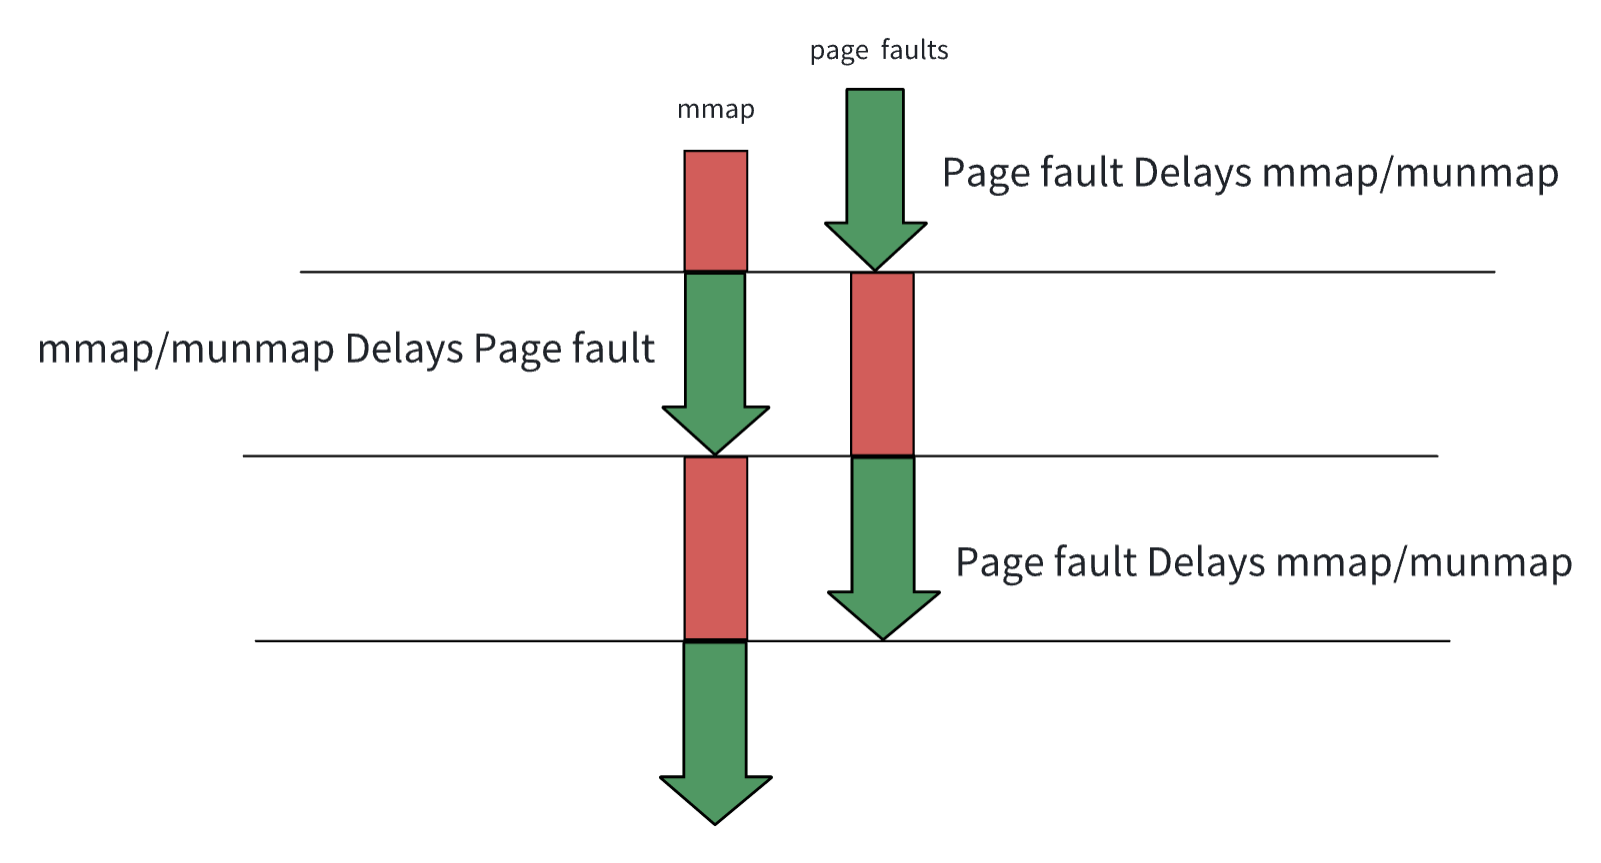
One of the most important resources in Linux is virtual memory, where a process’s virtual memory space is described by mm_struct( the memory descriptor). This structure contains all the information related to the process’s address space. Since there is only one mm_struct for a single process, a multi-threaded process that uses mmap is facing the contention problem brought up by a reader/writer semaphore called mmap_lock(in Linux kernel 5.8 it’s renamed from mmap_sem to mmap_lock), it’s a semaphore that controls changes to process memory mappings. Like any other rw_semaphore, it can be held by any number of shared readers or one exclusive writer.
struct mm_struct {
...
struct rw_semaphore mmap_lock;            /* memory area semaphore */
...
}


/*
* The caller must write-lock current->mm->mmap_lock.
  */
  unsigned long do_mmap(struct file *file, unsigned long addr,
  unsigned long len, unsigned long prot,
  unsigned long flags, vm_flags_t vm_flags,
  unsigned long pgoff, unsigned long *populate,
  struct list_head *uf)
mmap_lock’s responsibilities can be summarized as:
- protecting important mm_struct like red-black tree, the process VMA list and many other fileds of mm struct.(read this article: https://lwn.net/Articles/753058/)
- protecting VMAs from changing during page fault handling (we can verify this by checkouting function do_page_fault on https://android.googlesource.com/kernel/msm/+/3ab322a9e0a419e7f378770c9edebca17821bf6e/arch/arm/mm/fault.c)
Why does Linux use a heavy lock - mmap_lock to protect VMAs? The reason is historical, mmap_lock has been a part of the mm structure for decades. At the time, programs did not use multi-threading but rather “multi-processing”(think about PostgreSQL…),different processes have different virtual memory spaces. The mmap_lock contention was not a problem back then. Besides, computer memory at that time was much smaller, therefore, mmap_lock has fewer pages to lock. Now, you may have another question: both read/write systemcall and mmap work with VMAs, why is mmap particularly a victim to mmap_lock? This is because, in the case of page faults, this lock is acquired as a read lock. In the case of mmap/munmap this lock is acquired as a write lock (see this). When write lock comes into the picture, performance deteriorates dramatically.
By the way, don’t be confused by another lock named page_table_lock of mm-struct, they serve different purposes:
-
mmap_lock
This is a long-lived lock which protects the VMA list for readers and writers. As callers of this lock require it for a long time and may need to sleep, a spinlock is inappropriate. A reader of the list takes this semaphore with down_read(). If they need to write, it is taken with down_write() and the page_table_lock spinlock is later acquired while the VMA linked lists are being updated.
-
page_table_lock
This protects most fields in mm_struct. As well as the page tables, it protects the RSS (see below) count and the VMA from modification.
single-threaded page eviction
Although using mmap gives us the benefit of not using userspace buffer pool, it still relies on the page cache. The linux kernel maintains a set of least-recently-used (LRU) lists to track page cache. Thus, for a database that relies on mmap, it also relies on kswapd to perform efficiently.
kswapd is the kernel thread that is responsible for evicting pages from memory to disk when memory is running low. Since disk is much slower than memory, multi-threading is not necessary, therefore we have a single-threaded page evictor. Andy blames this single-threaded kswapd for mmap losing the “fio versus mmap sequential read battle”. However, it’s also noteworthy to mention that the LRU linked list in Linux is protected by the LRU lock. This could also be another factor.
TLB shootsdown
Here is a picture of shared-memory computer architecture. A computer has multiple cores but they all share one physical memory.
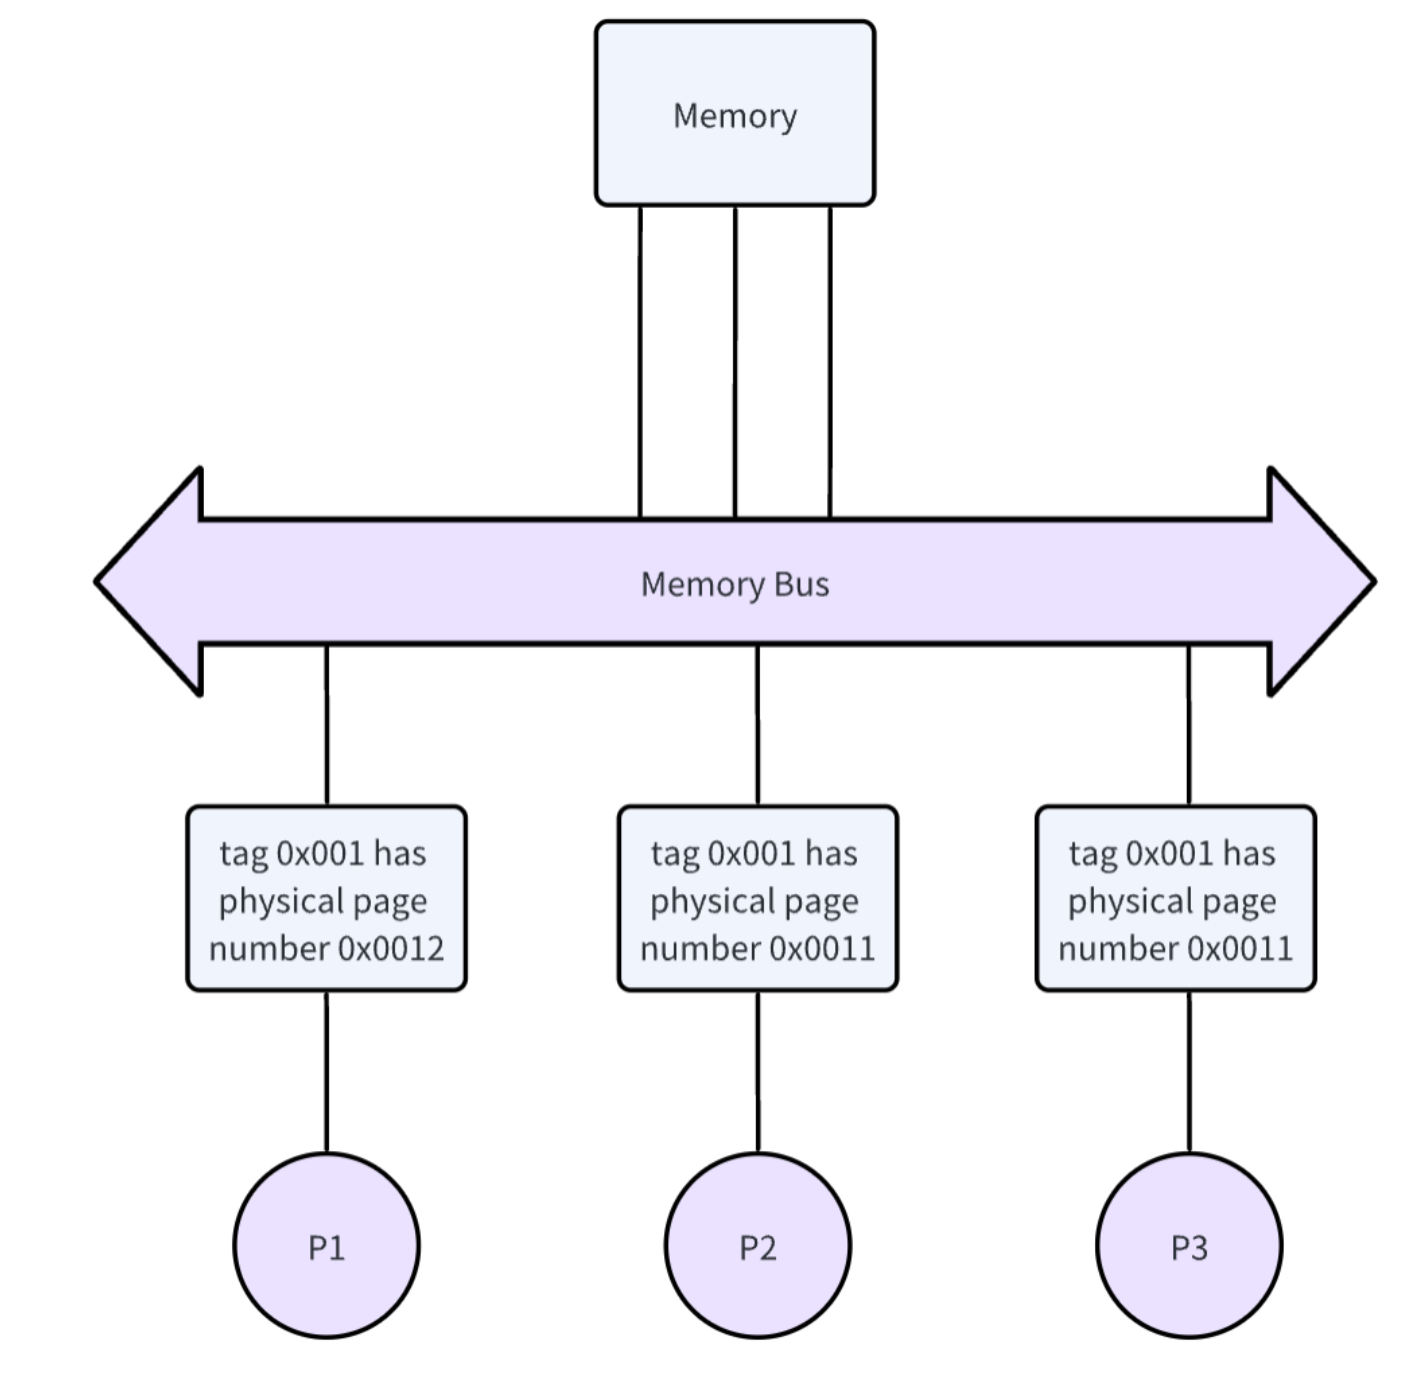
In shared-memory architecture, every processor contains a cache named Translation lookaside buffer(TLB) as we have mentioned earlier. TLBs make virtual address translation fast and it’s critical for database application performance.
When memory mapping changes, for example, tag 0x001 points to physical page number 0x0011, it points to 0x0012 afterward, coherence must be guaranteed among the processors. Since there is no hardware mechanism to ensure TLB coherence, the job is left to the Operating System. To ensure TLB coherence, the Operating System performs a TLB shootdown, which is a mechanism to invalidate remote TLB entries on other cores. TLB shootdown can be triggered by various memory operations that modify page table entries. One of the reasons is related to munmap, which deletes the mappings for the specified address range, and causes further references to addresses within the range to generate invalid memory references. On the other hand, when a process calls mmap and the OS creates new entries in the process’s virtual address space, the OS does not need to flush the TLB since there are no TLB entries at the time.
How Prometheus stores its data
What have been memory-mapped
On a machine that has umon(an wrapper of Prometheus) running on it, run cat /proc/{pid of umon}/maps, so you will get contiguous virtual memory areas used by Prometheus. The output from my machine is listed in the table below. In short, virtual addresses that are unused or used by shared object files are stripped off. Shared libraries are memory-mapped so that forking a child process can be fast, and memory is saved since processes don’t have to copy duplicate code into their text segments.
00400000-044e3000 r-xp 00000000 fd:01 675313727                          /opt/umon/bin/umon
046e2000-047ae000 rw-p 040e2000 fd:01 675313727                          /opt/umon/bin/umon
7fcf9136d000-7fcf9936d000 r--s 00000000 fd:01 834677674                  /opt/umon/prometheus-data/chunks_head/000061
7fcf9936d000-7fcf9f1ea000 r--s 00000000 fd:01 268448993                  /opt/umon/prometheus-data/01GRFAGZGWZPMMEC1RZ3KRR8PD/chunks/000001
7fcfa69c8000-7fcfac3e0000 r--s 00000000 fd:01 180719137                  /opt/umon/prometheus-data/01GRN3XKJBFGP68Z19KSR6H2TQ/chunks/000001
7fcfaf0dd000-7fcfb70dd000 r--s 00000000 fd:01 834677679                  /opt/umon/prometheus-data/chunks_head/000060
7fcfb70dd000-7fcfb75a6000 r--s 00000000 fd:01 177000146                  /opt/umon/prometheus-data/01GRN3XKJBFGP68Z19KSR6H2TQ/index
7fcfb75a6000-7fcfb790f000 r--s 00000000 fd:01 151420465                  /opt/umon/prometheus-data/01GRN3XHFNBSEJ57MSP7106R2Q/chunks/000001
7fcfb790f000-7fcfb7c84000 r--s 00000000 fd:01 134347049                  /opt/umon/prometheus-data/01GRMX1T82JHV2HC7YFGYYPVJN/chunks/000001
7fcfc82d0000-7fcfc87aa000 r--s 00000000 fd:01 264251793                  /opt/umon/prometheus-data/01GRFAGZGWZPMMEC1RZ3KRR8PD/index
7fcfc87aa000-7fcfc887d000 r--s 00000000 fd:01 398511374                  /opt/umon/prometheus-data/01GR9H4AK312ZTDC81ZBHVMARH/index
7fcfc887d000-7fcfc8c69000 r--s 00000000 fd:01 402839492                  /opt/umon/prometheus-data/01GR9H4AK312ZTDC81ZBHVMARH/chunks/000001
7fcfc8d5f000-7fcfc8e2a000 r--s 00000000 fd:01 255988632                  /opt/umon/prometheus-data/01GRNHMXNS52464DJX5WRYSZ6A/index
7fcfc8e2a000-7fcfc8ef5000 r--s 00000000 fd:01 146873066                  /opt/umon/prometheus-data/01GRN3XHFNBSEJ57MSP7106R2Q/index
7fcfc8ef5000-7fcfc8fc0000 r--s 00000000 fd:01 130031109                  /opt/umon/prometheus-data/01GRMX1T82JHV2HC7YFGYYPVJN/index
7fcfc9040000-7fcfc93c3000 r--s 00000000 fd:01 260059119                  /opt/umon/prometheus-data/01GRNHMXNS52464DJX5WRYSZ6A/chunks/000001
7fcfc93c3000-7fcfc948e000 r--s 00000000 fd:01 234981699                  /opt/umon/prometheus-data/01GRNAS8RDR82J0X9V7H352736/index
7fcfc948e000-7fcfc97fb000 r--s 00000000 fd:01 239093592                  /opt/umon/prometheus-data/01GRNAS8RDR82J0X9V7H352736/chunks/000001
7fd020346000-7fd02034b000 rw-s 00000000 fd:01 826468484                  /opt/umon/prometheus-data/queries.active
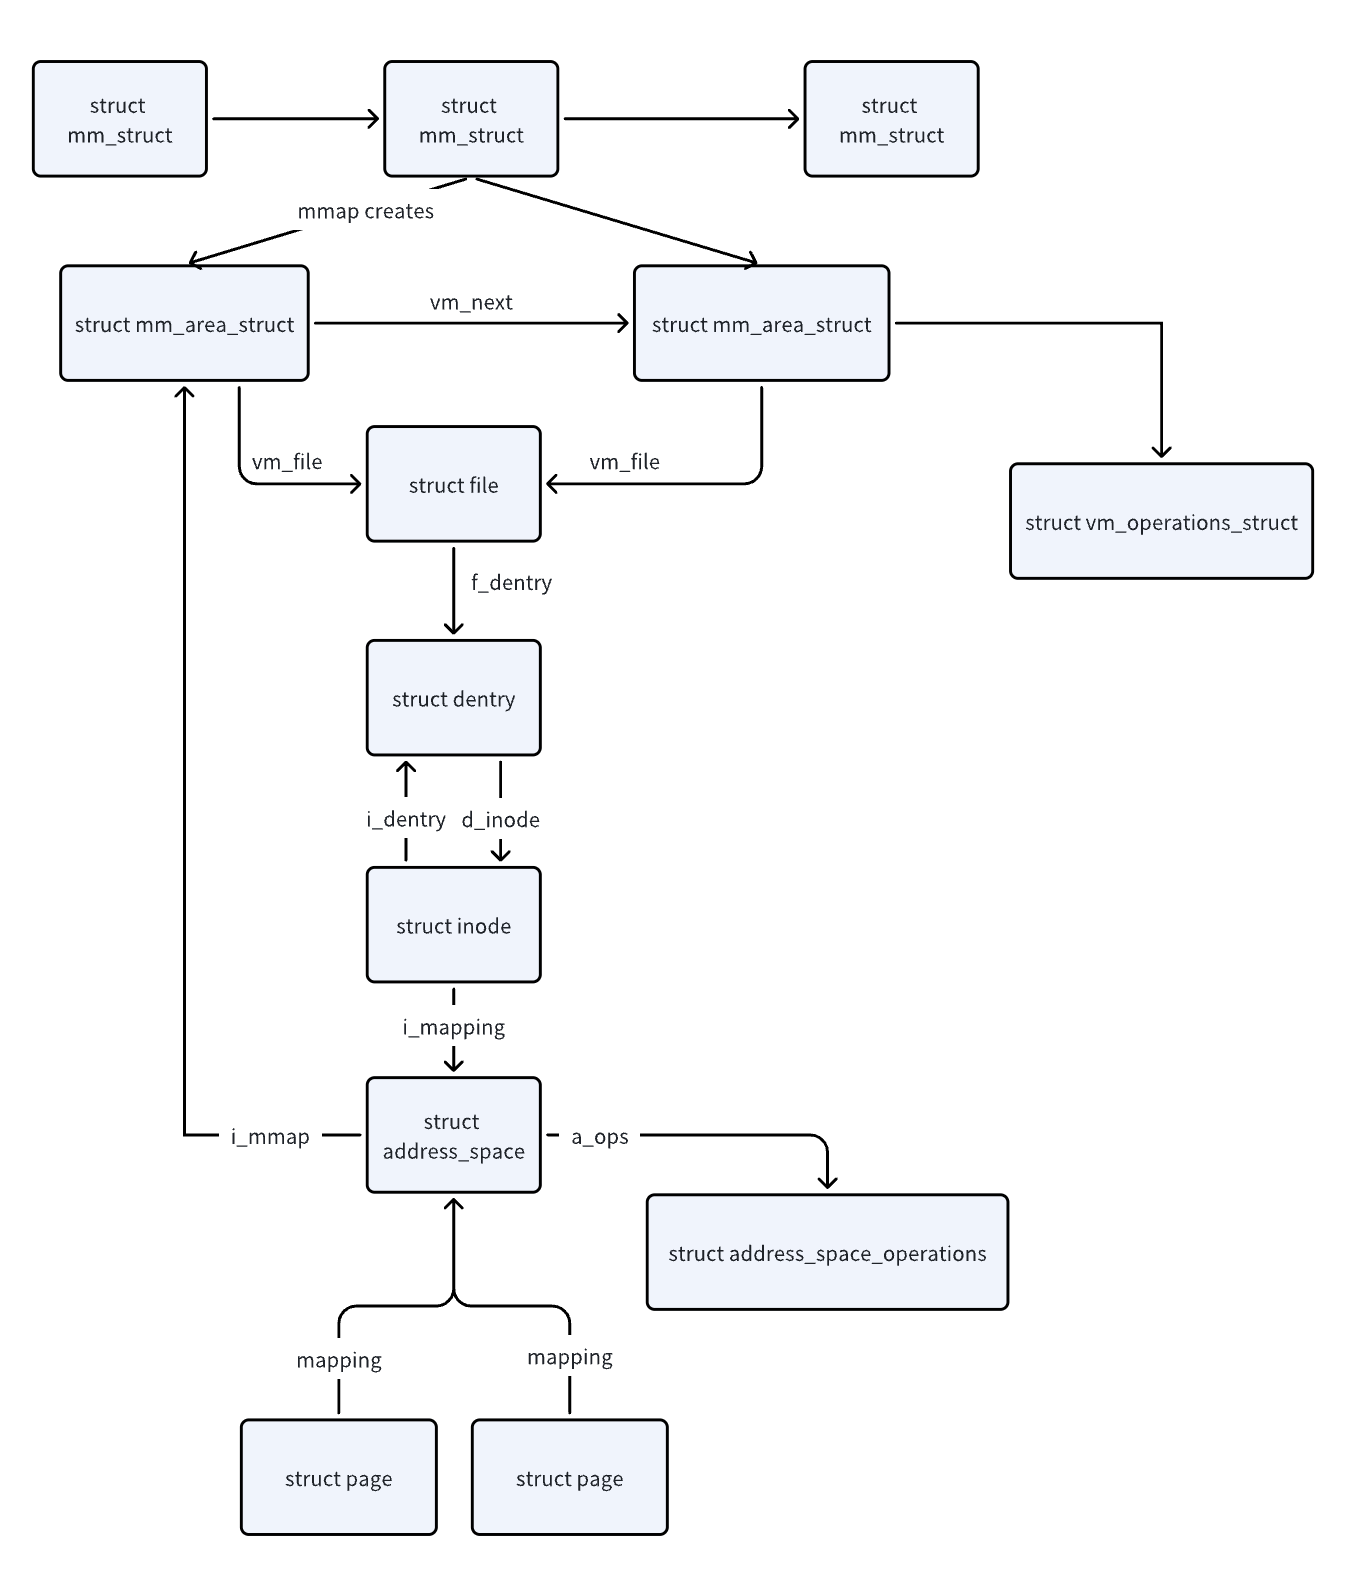
Before further discussing we need to know a struct named vm_area_struct that describes a contiguous virtual memory area, each userspace mmap syscall from a process will create a vm_area_struct , which is stored at each process’s task_struct maintained by the kernel. The output of cat /proc/pid/maps lists a part of the vm_area_struct, let’s pick one line of output and illustrate some of the important fields of this structure:
7fcf9136d000-7fcf9936d000 r--s 00000000 fd:01 834677674 /opt/umon/prometheus-data/chunks_head/000061
This line has six fields and two of them are not part of vm_area_struct: device number(fd:01) and inode number(834677674).
vm_start,vm_end7fcf9136d000 is the beginning address of the memory area 7fcf9936d000 is the end address of the memory area.vm_file/opt/umon/prometheus-data/chunks_head/000061 is the pointer to the associated file structure.vm_pgoff00000000 is the offset of the area within the file.pgprot_tr--sdefines access permissions of the memory area. The suffix s means this area is “shared”. This means changes to that area will be written back to the file and be visible to all processes.r--means this area is read-only, the second placeholder is for w(write) and the third id for x(execute). This permission shows that this Prometheus memory-mapped file is read-only and shared.vm_flagsa set of flags, not shown in the output.vm_opsa set of working functions for this area, not shown in the output.vm_next,vm_prevmemory areas of umon are chained by a list structure,not shown in the output.
So far, we have learned that Prometheus maps multiple files under the prometheus-data folder, what are these files and why they’re memory-mapped? To explain it, some basic prometheus 101 knowledge needs to be clarified.
How Prometheus persists its data
Prometheus’s TSDB is a timeseries database. Its data can be treated as streams of points.
Series_A -> (t0,A0), (t1, A1), (t2, A2), (t3, A3)...
Series_B -> (t0,B0), (t1, B1), (t2, B2), (t3, B3)...
Series_C -> (t0,C0), (t1, C1), (t2, C2), (t3, C3)...
For a Monitoring System, with possibly up to millions of data points per second, can Prometheus directly write everything into the storage device? Think about this: For a traditional disk, random write is a disaster since the disk head needs time to seek the track and the plate needs time to spin. For an SSD, writing to a non-empty block is done by first writing to an empty block and moving the data back. This is called “write amplification” and can significantly shorten the lifespan of the SSD. Therefore, Prometheus has no choice other than using a buffer to batch writes. Otherwise, the penalty could be huge. Where is this memory-buffer in Prometheus? The answer is a “head chunk”. To be more accurate, it’s actually a 32KB page in the head chunk. The behavior is comparable to Innodb engine, who also doesn’t work on rows but on pages. But unlike Innodb, Prometheus doesn’t have its own buffer pool, it has only a single page for writing. This buffer page is flushed into a file (A.K.A. segment) inside of WAL once it’s full. The layout of the WAL folder is like this:
17728 -rw-r--r-- 1 actiontech-universe actiontech 18153472 2月   9 03:00 00000076
17728 -rw-r--r-- 1 actiontech-universe actiontech 18153472 2月   9 05:00 00000077
17728 -rw-r--r-- 1 actiontech-universe actiontech 18153472 2月   9 07:00 00000078
4032 -rw-r--r-- 1 actiontech-universe actiontech  3621996 2月   9 07:24 00000079
0 drwxr-xr-x 2 actiontech-universe actiontech       22 2月   9 05:00 checkpoint.00000075
You may be wondering why this folder is called WAL and why there is a file named “checkpoint.xxxxxxxx”, and more confusingly, why are segements before 00000076 are gone? This is when the Write-Ahead-Logging (WAL) and checkpointing come into the picture. WAL is a must-go for almost all DBMS to ensure data integrity(Search ARIES for further reading). The core concept is that before we write anything to the data files, the operation has to be logged in case of a system crash or computer shut down. When Prometheus recovers from a crash, it first reads data from the chunks_head and then data in WAL. As a database administrator, you must have heard of InnoDB’s redo log. The redo log is a disk-based data structure used during crash recovery. The files listed above serve a similar purpose to the redo log, they provide durability for the head block(all other blocks are already persisted on the disk). This is also why all these files have sequential names: every log record in WAL has a globally unique log sequence number (LSN). Checkpointing is another concept in DBMS that always comes in pair with WAL. WAL logs would grow forever if there were no checkpointing, If a DBMS uses WAL, then it must also periodically take a checkpoint after it flushes WAL buffers to disk. Otherwise, after a crash Prometheus would take a long and painful start-up time. This is also why, over the years, Prometheus developers have made decisions like reducing WAL size(from 6 hours of data to 3 hours, see issue #7098) and flushing the head chunk to disk once it’s full(see issue #6679).
The complete function call chains can be simplified as the following graph.
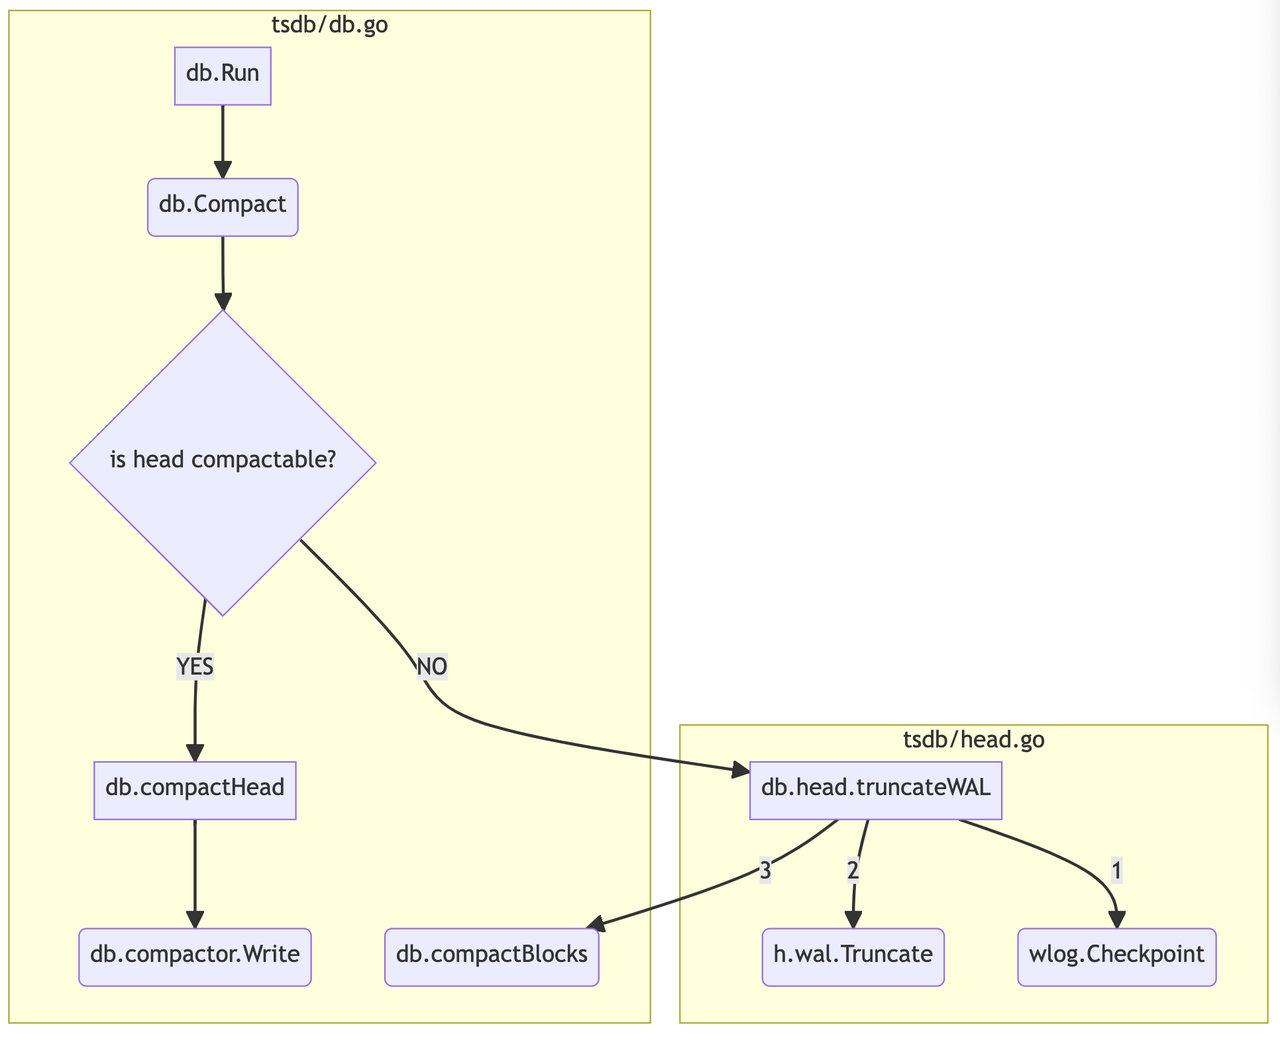 Whether a head is compactable is determined by the following code, since chunkRange is by default 2h, therefore the head is compactable every 3 hours.
// compactable returns whether the head has a compactable range.// The head has a compactable range when the head time range is 1.5 times the chunk range.// The 0.5 acts as a buffer of the appendable window.
func (h *Head) compactable() bool {
return h.MaxTime()-h.MinTime() > h.chunkRange.Load()/2*3
}
Since Prometheus by default scrapes data every 15 seconds, due to the fact that each chunk can hold up to 120 samples(issue #11219 mentions that this number may should be increased), Therefore, we can easily come to a conclusion that a single Prometheus chunk by default can hold up to 30 minutes of data. Plus, the fact we just found that Prometheus’s head chunk can hold up to 3 hours of data. Therefore, we can conclude that Prometheus’s chunks_head can have up to 6 chunks, and at most 5 of them are flushed to the disk and memory-mapped. Since Prometheus adopts a single-writer mode, there is always one and only one chunk that can be written into and is not flushed to disk and memory-mapped.
When a head compaction happens, the chunks in the “chunks_head” dir are written to a new persistent block and then they are removed by head.truncateMemory.
In Prometheus, checkpoint goes through all WAL files since minTime. This means minTime equals maxTime in db.CompactHead. Which means every-time Prometheus compacts its head, the WAL checkpointing collects WAL data appended after maxTime of the previous compaction. The WAL checkpointing works on the following data types:
- record.Series ( a combination of a metric name and a particular set of key-value labels)
- record.Samples (sparse records of a series)
- record.HistogramSamples (see issue #11210, histogram samples are samples of a histogram metric)
- record.Tombstones (deletion markers that block queries)
- record.Exemplars (Exemplars are references to data outside of the MetricSet. A common use case are IDs of program traces.)
- record.Metadata (see issue #10972, metadata is all about series and their labels)
Then WAL checkpointing creates a new checkpoint folder whose name is like checkpoint.00000xxx and writes all the data collected into this folder, just like WAL files are written into “wal”, so don’t be surprised if you open the folder and find a file named 00000000 inside of it. WAL files before 00000xxx can be delet
prometheus-data
|____wal
|___000000072
|___000000073
|___000000074
|___000000075
|___000000076
|___000000077
To figure out why the lower two thirds of segments are checkpointed we have to read some source code in prometheus/tsdb/head.go:
// truncateWAL removes old data before mint from the WAL.
func (h *Head) truncateWAL(mint int64) error {
1   first, last, err := wlog.Segments(h.wal.Dir())
...
2   last-- // Never consider last segment for checkpoint.
3   if last < 0 {
4      return nil // no segments yet.
5   }
// The lower two thirds of segments should contain mostly obsolete samples.
// If we have less than two segments, it's not worth checkpointing yet.
// With the default 2h blocks, this will keeping up to around 3h worth
// of WAL segments.
6   last = first + (last-first)*2/3
7   if last <= first {
8      return nil
9   }
...
}
To make facts more clear here are two ls -l outputs before a checkpointing and after a checkpointing: Before the next checkpointing:
-rw-r--r-- 1 actiontech-universe actiontech 19300352 2月  11 07:00 00000008
-rw-r--r-- 1 actiontech-universe actiontech 19300352 2月  11 09:00 00000009
-rw-r--r-- 1 actiontech-universe actiontech 19300352 2月  11 11:00 00000010
-rw-r--r-- 1 actiontech-universe actiontech 16314758 2月  11 12:41 00000011
drwxr-xr-x 2 actiontech-universe actiontech       22 2月  11 09:00 checkpoint.00000007
After the next checkpointing:
-rw-r--r-- 1 actiontech-universe actiontech 17334272 2月  11 12:47 00000011
-rw-r--r-- 1 actiontech-universe actiontech  1966080 2月  11 13:00 00000012
-rw-r--r-- 1 actiontech-universe actiontech 19300352 2月  11 15:00 00000013
-rw-r--r-- 1 actiontech-universe actiontech  1694088 2月  11 15:10 00000014
drwxr-xr-x 2 actiontech-universe actiontech       22 2月  11 13:00 checkpoint.00000010
These two outputs show that checkpoint.00000010 is created right after 00000012. This is because, from the above source code we can see that
(last-first)*2/3must be greater than 2(This number should be 1 without line 6), otherwise the function call returns. Since(12-8) x 2/3 > 2, therefore, when log 00000012 was created, the next checkpointing was also created. After that, all old WAL files before the checkpoint are deleted byh.wal.Truncateand the old checkpoint is deleted viawlog.DeleteCheckpoints.
Conclusion
mmap is an old concept, it was born at a time when computer memories were small and programs weren’t multi-threading. mmap based file IO is beaten hard by direct IO in benchmark due to problems mentioned above. The TSDB of Prometheus works like a log structured merge tree. Unlike relational databases such as MySQL,Postgresql, the workload of Prometheus is write-heavy, new data is constantly written to Prometheus’s head chunk, which indeed is buffered and is not memory-mapped, performance issues that hurt mmap are irrelevant in this regard. Andy’s paper references VictoriaMetrics’s tech article “mmap may slow down your Go app” and tries to show that mmap is a problem for VictoriaMetrics. However, this is not true and VictoriaMetrics still uses mmap for file IO.
References
- https://linux-kernel-labs.github.io/refs/heads/master/labs/memory_mapping.html
- https://grafana.com/blog/2020/06/10/new-in-prometheus-v2.19.0-memory-mapping-of-full-chunks-of-the-head-block-reduces-memory-usage-by-as-much-as-40/
- https://github.com/prometheus/prometheus
- http://books.gigatux.nl/mirror/kerneldevelopment/0672327201/ch14lev1sec2.html
- http://web.cs.ucla.edu/classes/honors/UPLOADS/kousha/thesis.pdf
- http://www.bitsavers.org/pdf/sun/sunos/4.0/800-1731-07r50_Release_4.0_Change_Notes_for_the_Sun_Workstation_198701.pdf
- https://db.cs.cmu.edu/papers/2022/cidr2022-p13-crotty.pdf
- https://www.singlestore.com/blog/linux-off-cpu-investigation/
- https://www.kernel.org/doc/html/v4.18/core-api/cachetlb.html
- https://www.kernel.org/doc/gorman/html/understand/understand007.html
- https://www.usenix.org/system/files/atc20-papagiannis.pdf
- https://courses.cs.washington.edu/courses/cse551/15sp/notes/talk-rcu.pdf
- https://www.kernel.org/doc/html/v4.18/core-api/cachetlb.html
- https://valyala.medium.com/mmap-in-go-considered-harmful-d92a25cb161d